
Enterprise cloud migration was supposed to reduce infrastructure costs while accelerating engineering velocity.
Instead, unmonitored cloud sprawl, over-provisioned Kubernetes clusters, and opaque vendor billing models have turned public cloud platforms into one of the largest unmanaged expenses on executive balance sheets.
Without a structured finops cloud cost optimization strategy, organizations frequently burn 30% to 45% of their total cloud budget on idle resources, misconfigured storage tiers, and unallocated network egress.
Modern cloud financial management requires moving beyond reactionary instance downsizing. It demands a culture of financial accountability paired with real-time architectural visibility.
This guide outlines a comprehensive enterprise FinOps framework designed to align engineering speed with fiscal governance across AWS, Microsoft Azure, and Google Cloud Platform (GCP).
Table of Contents
- Understanding FinOps: Financial Accountability in the Cloud Era
- The Core Pillars of Enterprise Cloud Cost Management
- Proprietary Framework: The TRIM-U Cloud Optimization Model
- Architectural Deep Dive: Eliminating Waste Across Compute, Storage, and Kubernetes
- Unit Economics: Linking Cloud Spend to Business Revenue
- Commitment Management: Navigating Savings Plans vs. Reserved Instances
- Stage-Based Implementation Roadmap
- Common FinOps Implementation Traps & Mitigation Strategies
- FinOps Audit Checklist for Enterprise Leaders
- Conclusion
Understanding FinOps: Financial Accountability in the Cloud Era
What is FinOps?
FinOps (Cloud Financial Operations) is an operational framework and cultural practice that brings financial accountability to the variable spend model of public cloud computing.
It enables engineering, finance, and technology leadership teams to collaborate on data-driven purchasing decisions, balancing speed, quality, and cost.
Unlike traditional IT procurement, which relied on fixed annual capital expenditures (CapEx), FinOps operates on a dynamic operating expenditure (OpEx) model where every engineer’s code deployment directly impacts the monthly bill.
Integrations with strategic enterprise AI integration and automated pipeline monitoring now allow teams to track these financial shifts automatically.
+-------------------------------------------------------------------+
|                        THE FINOPS CYCLE                           |
|                                                                   |
|   +-----------------+      +-----------------+      +---------+   |
|   |     INFORM      | ---> |    OPTIMIZE     | ---> | OPERATE |   |
|   | Visibility &    |      | Rates &         |      | Continuous  |
|   | Allocation      |      | Architecture    |      | Governance  |
|   +-----------------+      +-----------------+      +---------+   |
|            ^                                             |        |
|            +---------------------------------------------+        |
+-------------------------------------------------------------------+
The Enterprise Cost Crisis: Why Cloud Spend Escalates
Cloud cost inflation is rarely caused by a single architectural failure.
Instead, it stems from hundreds of micro-decisions made by decentralized development teams prioritizing deployment velocity over resource efficiency.
- Over-provisioning as safety margin: Developers frequently allocate 4x to 8x the required CPU and RAM to prevent performance degradation under peak load.
- Unattributed resource sprawl: Abandoned sandbox environments, detached EBS volumes, and unindexed snapshots continue to bill indefinitely.
- Kubernetes resource opacity: Shared clusters obscure which application, team, or microservice is consuming compute resources.
- Data egress traps: Multi-region and multi-cloud data movement generates unexpected networking charges.
Addressing these issues requires structured alignment between engineering priorities and enterprise budget constraints, building upon an established enterprise growth strategy.
The Core Pillars of Enterprise Cloud Cost Management
A resilient cloud cost management framework rests on three foundational capabilities: operational visibility, rate optimization, and architectural efficiency.

1. Granular Cost Allocation and Tagging Governance
You cannot optimize what you cannot measure.
Achieving 95%+ cost allocation accuracy requires a standardized enterprise tagging policy enforced via automated CI/CD guardrails and cloud provider policies.
| Tag Key | Example Value | Business Purpose |
|---|---|---|
Environment | Production, Staging, Sandbox | Distinguishes core production workloads from non-critical environments. |
CostCenter | CC-8042-FinTech | Maps cloud infrastructure directly to corporate general ledger accounts. |
Owner | payments-squad@company.com | Establishes direct operational accountability for resource remediation. |
ServiceClass | Tier-1-Core, Tier-3-Batch | Guides automated shutdown and spot instance substitution rules. |
2. Rate Optimization vs. Usage Optimization
Enterprise cost reduction is split into two distinct execution vectors:
- Rate Optimization: Paying less per unit of resource without changing application code (e.g., AWS Savings Plans, Azure Reserved Instances, GCP Committed Use Discounts).
- Usage Optimization: Consuming fewer units through rightsizing, autoscaling, serverless migration, and idle resource termination.
While rate optimization yields immediate quick wins for procurement teams, usage optimization provides compounding long-term savings for engineering organizations.
Proprietary Framework: The TRIM-U Cloud Optimization Model
To help enterprises systematic eliminate cloud waste without stalling developer velocity, we created the TRIM-U Framework (Target, Rearchitect, Inform, Measure, Unify).
   TRIM-U FRAMEWORK FOR ENTERPRISE FINOPS
   --------------------------------------------------------
   [ T ] TARGET      -> Identify idle assets & easy wins
   [ R ] REARCHITECT -> Rightsize, autoscale & containerize
   [ I ] INFORM      -> Surface unit cost to developers
   [ M ] MEASURE     -> Track efficiency against revenue
   [ U ] UNIFY       -> Integrate Finance, DevOps & SecOps
1. Target (Immediate Waste Elimination)
Focus on zero-risk, high-return cleanup items:
- Identify unattached block storage volumes (AWS EBS, Azure Managed Disks).
- Terminate unassociated Elastic IPs and NAT Gateways processing zero traffic.
- Delete obsolete database snapshots older than corporate retention policies.
2. Rearchitect (Workload Optimization)
Transform infrastructure to match real utilization patterns:
- Migrate stateful monolithic services to autoscaling containerized workloads.
- Transition legacy x86 compute instances (e.g., AWS Graviton3/Graviton4 arm64 processors) to reduce compute costs by 20% to 40%.
- Implement dynamic scheduling to automatically turn off non-production environments during non-business hours.
3. Inform (Real-Time Cost Visibility)
Shift financial feedback loops left into engineering workflows:
- Integrate cost-estimating bots into Pull Requests (e.g., Infracost) to show engineers the cost impact of infrastructure code changes before deployment.
- Deliver automated weekly spend digests to team leads with anomalous growth alerts.
4. Measure (Unit Economics Alignment)
Evaluate cost metrics through the lens of business productivity:
- Stop evaluating overall spend in isolation; track Cost per Active User, Cost per Transaction, or Cost per API Call.
- Establish baseline efficiency standards across engineering squads.
5. Unify (Governance & Cross-Functional Operations)
Break down institutional silos between Finance, Technology, and Procurement:
- Form a centralized FinOps Center of Excellence (CCOE) combining cloud architects, financial analysts, and engineering leads.
- Establish shared KPI targets where engineering teams share responsibility for cloud gross margins.
- Integrate cloud spend auditing with broader enterprise risk management protocols.
Architectural Deep Dive: Eliminating Waste Across Compute, Storage, and Kubernetes
Executing an effective enterprise finops strategy requires deep technical remediation across core cloud building blocks.
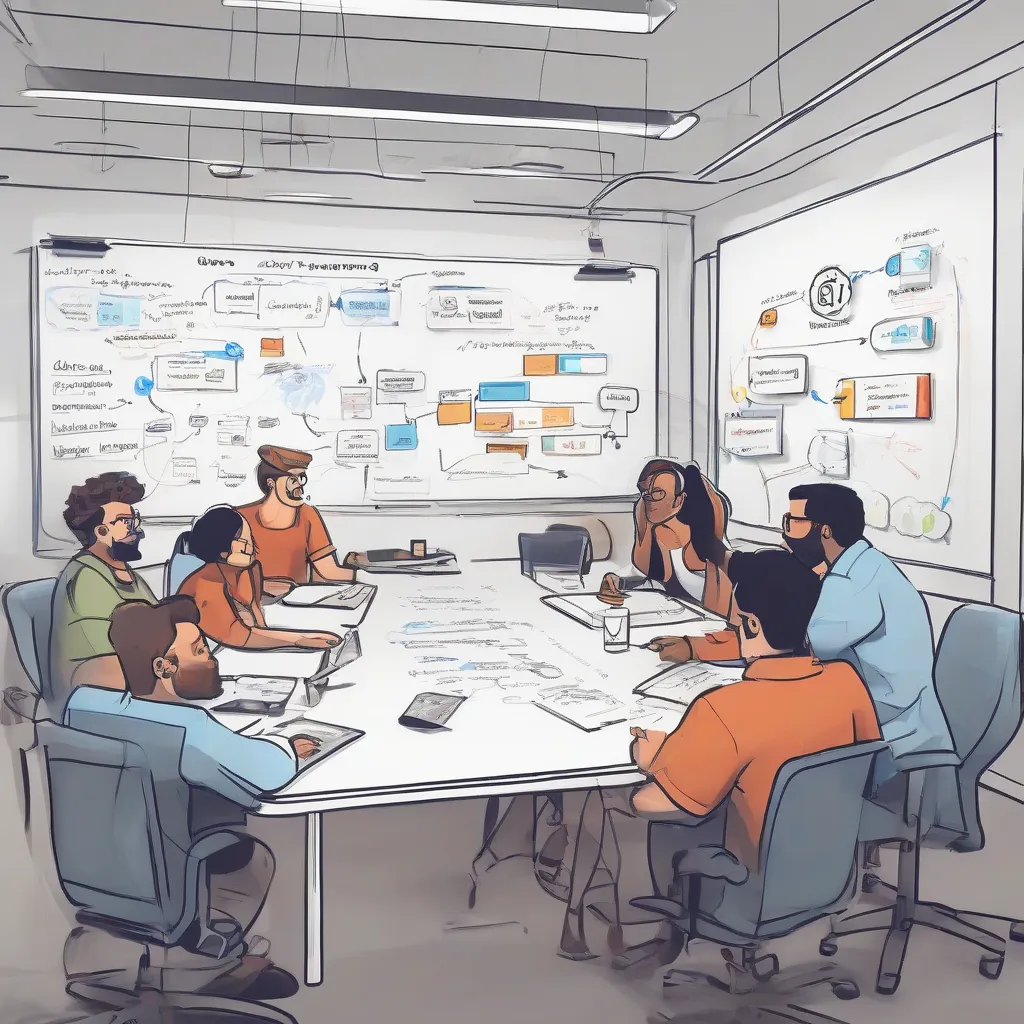
Kubernetes Cloud Cost Optimization
Kubernetes abstract underlying physical servers, making resource tracking difficult without specialized tooling.
Workload over-provisioning in EKS, AKS, or GKE typically accounts for up to 50% of wasted compute spending.
+-----------------------------------------------------------------------+
|                   KUBERNETES RESOURCE ALLOCATION                      |
|                                                                       |
|  [----------------------- Node Capacity -----------------------]      |
|  [--- Resource Requests (Billed) ---][--- Unallocated / Wasted ---]   |
|  [ Actual Usage ][ Over-Provisioned ]                                 |
+-----------------------------------------------------------------------+
Key Remediation Steps for Kubernetes
- Set Accurate Resource Requests: CPU and memory requests determine node scheduling and cluster sizing. Align requests to actual 95th percentile consumption metrics using tools like OpenCost or Kubecost.
- Implement Vertical Pod Autoscaler (VPA): Automatically adjust container requests based on historical usage patterns.
- Deploy Horizontal Pod Autoscaler (HPA) with Custom Metrics: Scale pod counts based on queue depth or HTTP request throughput rather than static CPU thresholds.
- Leverage Mixed Node Groups: Combine On-Demand instances for system critical pods with Spot instances for stateless microservices.
Storage Lifecycle Policy Engine
Data storage costs compound quietly over time. Implementing structured lifecycle rules prevents exponential budget expansion.
| Storage Tier | AWS S3 Equivalent | Access Latency | Cost per GB/Month (Approx) | Primary Use Case |
|---|---|---|---|---|
| Standard | S3 Standard | Milliseconds | ~$0.023 | Hot application data, active assets |
| Infrequent Access | S3 Standard-IA | Milliseconds | ~$0.0125 | Operational logs, monthly reports |
| Cold Storage | S3 Glacier Flexible | Minutes to Hours | ~$0.0036 | Annual compliance archives |
| Deep Archive | S3 Glacier Deep Archive | 12 Hours | ~$0.00099 | Long-term backup media |
Automate transitions between these tiers by configuring policy engines to move objects automatically after 30, 90, and 180 days of inactivity.
Unit Economics: Linking Cloud Spend to Business Revenue
Evaluating cloud costs in absolute dollar terms gives an incomplete picture of business efficiency.
If cloud infrastructure spend increases by 20%, but processing volume increases by 100%, infrastructure efficiency has actually improved.
Key Unit Economic Formulas
To build actionable financial insights, calculate your primary revenue efficiency metrics:
$$\text{Cost per Transaction} = \frac{\text{Total Monthly Infrastructure Spend}}{\text{Total Monthly Completed Transactions}}$$
$$\text{Cost per Active Customer} = \frac{\text{Monthly Cloud Cost attributed to User Tier}}{\text{Total Monthly Active Users (MAU)}}$$
By monitoring these ratios, engineering leaders can justify infrastructure investments that directly scale business revenue, applying principles similar to automated business process automation systems.
Commitment Management: Navigating Savings Plans vs. Reserved Instances
Purchasing commitments offer up to 72% discounts off standard on-demand pricing in exchange for 1-year or 3-year term agreements.
However, poorly managed commitments can lock an enterprise into outdated architecture.
       COMMITMENT COMPARISON MATRIX
       ----------------------------------------------------
       FLEXIBILITY               SAVINGS POTENTIAL
       Low  [===================] High

       AWS EC2 RIs (Standard)   -> Max Savings (Up to 72%) / Zero Flexibility
       AWS Compute Savings Plan -> Medium Savings (Up to 66%) / High Flexibility
       Azure Savings Plan       -> Medium Savings (Up to 65%) / Multi-Compute
Strategic Commitment Allocation Rule (The 70/20/10 Rule)
To maximize discount capture while maintaining operational flexibility:
- 70% Base Coverage: Cover your core, predictable workload baseline with 3-year Compute Savings Plans or Flexible Committed Use Discounts.
- 20% Dynamic Coverage: Cover variable secondary growth with 1-year commitments or convertible reservations.
- 10% On-Demand / Spot: Leave the remaining 10% on flexible On-Demand or Spot compute instances to absorb unexpected spikes without commitment risk.
Stage-Based Implementation Roadmap
Adopting an enterprise-wide cloud financial management framework takes time.
Use this phase-by-phase roadmap to mature your FinOps practices progressively.
Crawl Phase (Months 1–3)
- Establish centralized cloud billing access across all cloud provider accounts.
- Enforce mandatory tagging standards for
Environment,Owner, andCostCenter. - Identify and remove unattached storage volumes, unassociated EIPs, and idle compute instances to achieve immediate cloud waste reduction tactics.
- Form a cross-functional core FinOps working group with Finance and Engineering representatives.
Walk Phase (Months 4–8)
- Deploy specialized cloud financial management tools (e.g., Vantage, CloudHealth, Kubecost, or native Cost Explorer engines).
- Implement automated non-production resource scheduling (off-hours shutdown routines).
- Establish baseline commitment coverage target (50% to 60% of baseline compute spend).
- Publish team-level monthly cloud cost dashboards.
Run Phase (Months 9+)
- Integrate automated pull-request cost estimation inside developer workflow productivity automation tooling.
- Establish real-time unit economics reporting integrated with business BI dashboards.
- Automate Kubernetes request/limit adjustments using advanced vertical autoscalers.
- Achieve 80%+ commitment discount coverage across all primary production accounts.
Common FinOps Implementation Traps & Mitigation Strategies
Implementing cost controls can introduce operational friction if managed without clear alignment.
Watch out for these common pitfalls:
Pitfall 1: Finance Dictating Architectural Decisions
When finance teams independently issue mandate orders to shut down or downgrade instances, system outages frequently follow.
Mitigation: Finance sets target budget boundaries and unit efficiency metrics, but engineering teams retain full control over how architectural optimizations are executed.
Pitfall 2: Over-Committing for Maximum Discount Rate
Signing 3-year commitments to achieve a 70% discount rate can backfire if your engineering team plans to migrate from virtual machines to serverless or managed container platforms within 12 months.
Mitigation: Match commitment types to long-term technology roadmaps. Use flexible Compute Savings Plans rather than rigid instance-specific reservations when modernizing architecture.
Pitfall 3: Ignoring Network Egress Costs
Engineers often focus exclusively on CPU and RAM, overlooking multi-region network routing costs.
Cross-AZ data movement and egress out to third-party SaaS vendors can quietly represent up to 20% of an enterprise cloud bill.
Mitigation: Architect internal services using localized VPC Endpoints, private service gateways, and regional CDN caches.
FinOps Audit Checklist for Enterprise Leaders
Use this execution checklist during monthly cloud architecture reviews to ensure financial governance standards are maintained.
[ ] Enterprise Tagging Compliance
    [ ] 95%+ of active cloud resources possess mandatory operational tags.
    [ ] Untagged resource creation is automatically flagged via policy engines.

[ ] Compute Optimization
    [ ] Non-production instances automatically scale down outside business hours.
    [ ] Latest-generation processor architectures (e.g., ARM/Graviton) are evaluated.
    [ ] Spot instances are utilized for stateless batch workloads.

[ ] Kubernetes Workload Governance
    [ ] Container CPU/RAM requests match 95th percentile utilization metrics.
    [ ] Cluster autoscalers are configured with mixed instance types.
    [ ] Multi-tenant pod expenditure is fully attributed to product teams.

[ ] Storage & Network Efficiency
    [ ] S3/Blob storage lifecycles automatically transition cold data to deep archive.
    [ ] Unattached EBS/Managed Disks are deleted within 7 days of detachment.
    [ ] Egress traffic patterns are mapped to minimize cross-region data transfer.

[ ] Commitment Portfolio Strategy
    [ ] Baseline compute coverage stays between 70% and 80%.
    [ ] Expiration dates for 1-year and 3-year plans are tracked in procurement calendars.
Strategic Comparison: Native Cloud vs. Dedicated FinOps Platforms
Choosing the right tooling ecosystem depends on infrastructure complexity and team maturity.
| Capability | Native Cloud Tools (AWS Cost Explorer, Azure Cost Management) | Dedicated Third-Party Platforms (Vantage, Kubecost, CloudHealth) |
|---|---|---|
| Multi-Cloud Aggregation | Poor (Requires manual custom dashboarding) | Excellent (Native unified multi-cloud views) |
| Kubernetes Cost Granularity | Basic namespace estimation | Deep pod, deployment, and label-level tracking |
| Implementation Effort | Low (Pre-built into cloud consoles) | Moderate (Requires agent installation & IAM roles) |
| Anomaly Detection | Standard threshold-based alerts | Advanced ML-based anomaly detection engines |
| Total Cost of Ownership | Included with cloud platform fees | Subscription SaaS pricing based on cloud spend % |
Conclusion
Enterprise cloud cost optimization is not a one-time auditing exercise; it is a continuous engineering discipline.
By implementing structured cost visibility, optimizing compute commitments, rightsizing containerized workloads, and aligning spend with business unit economics, enterprise organizations can cut cloud expenditure by 30% or more while maintaining development momentum.
Building a sustainable FinOps culture empowers engineering teams to treat cost as an essential architectural metric—delivering scalable, high-performance applications that drive sustainable business profitability.
Frequently Asked Questions
How long does it take to see ROI from a FinOps initiative?
Most enterprise organizations achieve positive ROI within 30 to 60 days by identifying and eliminating immediate cloud waste, such as unattached storage volumes, idle non-production compute, and obsolete snapshots.
What team structure is required to run FinOps effectively?
A standard FinOps Center of Excellence (CCOE) consists of a dedicated Cloud Financial Manager, a Senior Cloud/DevOps Architect, a Financial Business Partner, and executive sponsorship from the VP of Infrastructure or CTO.
How does FinOps differ from traditional IT budgeting?
Traditional IT budgeting relies on fixed annual capital expenses (CapEx) with procurement approvals. FinOps manages dynamic operational expenses (OpEx) driven by code deployments, replacing annual billing reviews with real-time financial monitoring.